Part of 02 · Research artists and venues
Four live dashboards and nine shareable reports, all reading the same weekly-refreshed dataset. Scope any of them to the nation, a state or a region, and the numbers follow.
Dashboards
From the national picture down to your own venue. Every tile is a live query, and every number can be traced to the rows behind it.
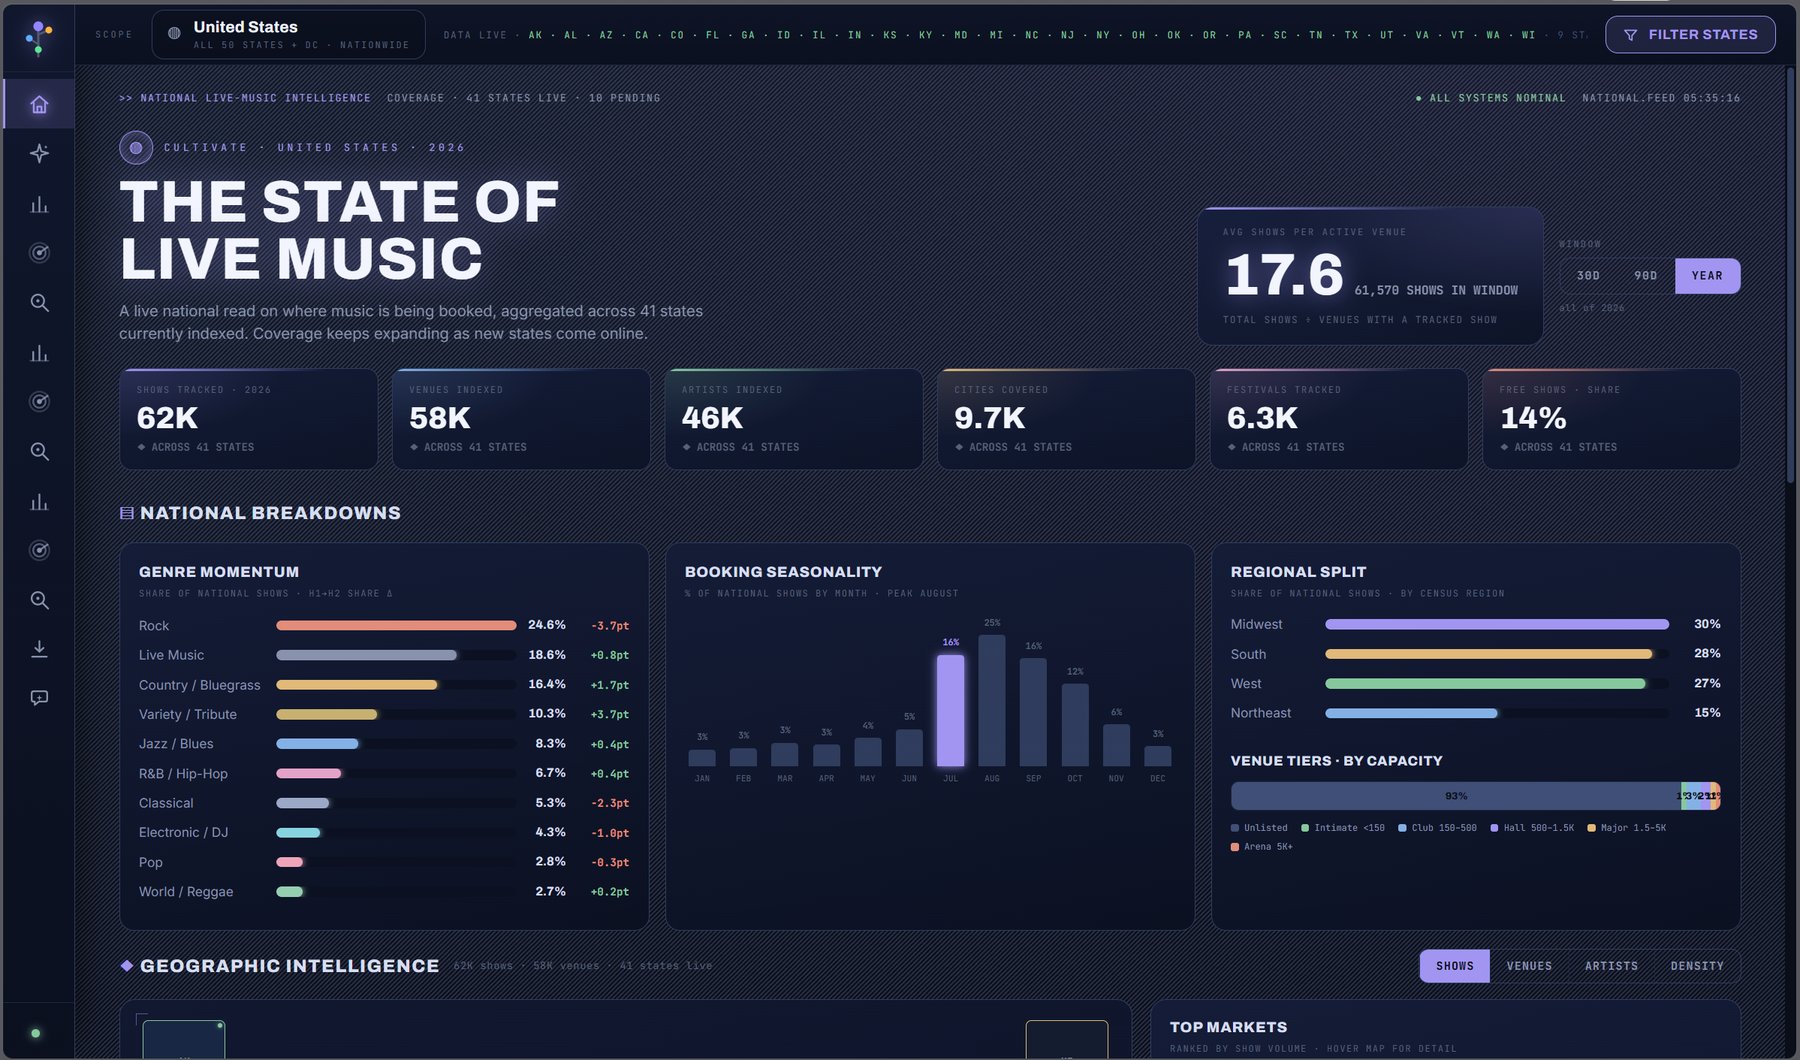
The state of live music. Shows, venues, artists, cities and festivals at a glance, then genre momentum, booking seasonality, regional split and venue tiers by capacity. Switch the window to 30 days, 90 days or the year.
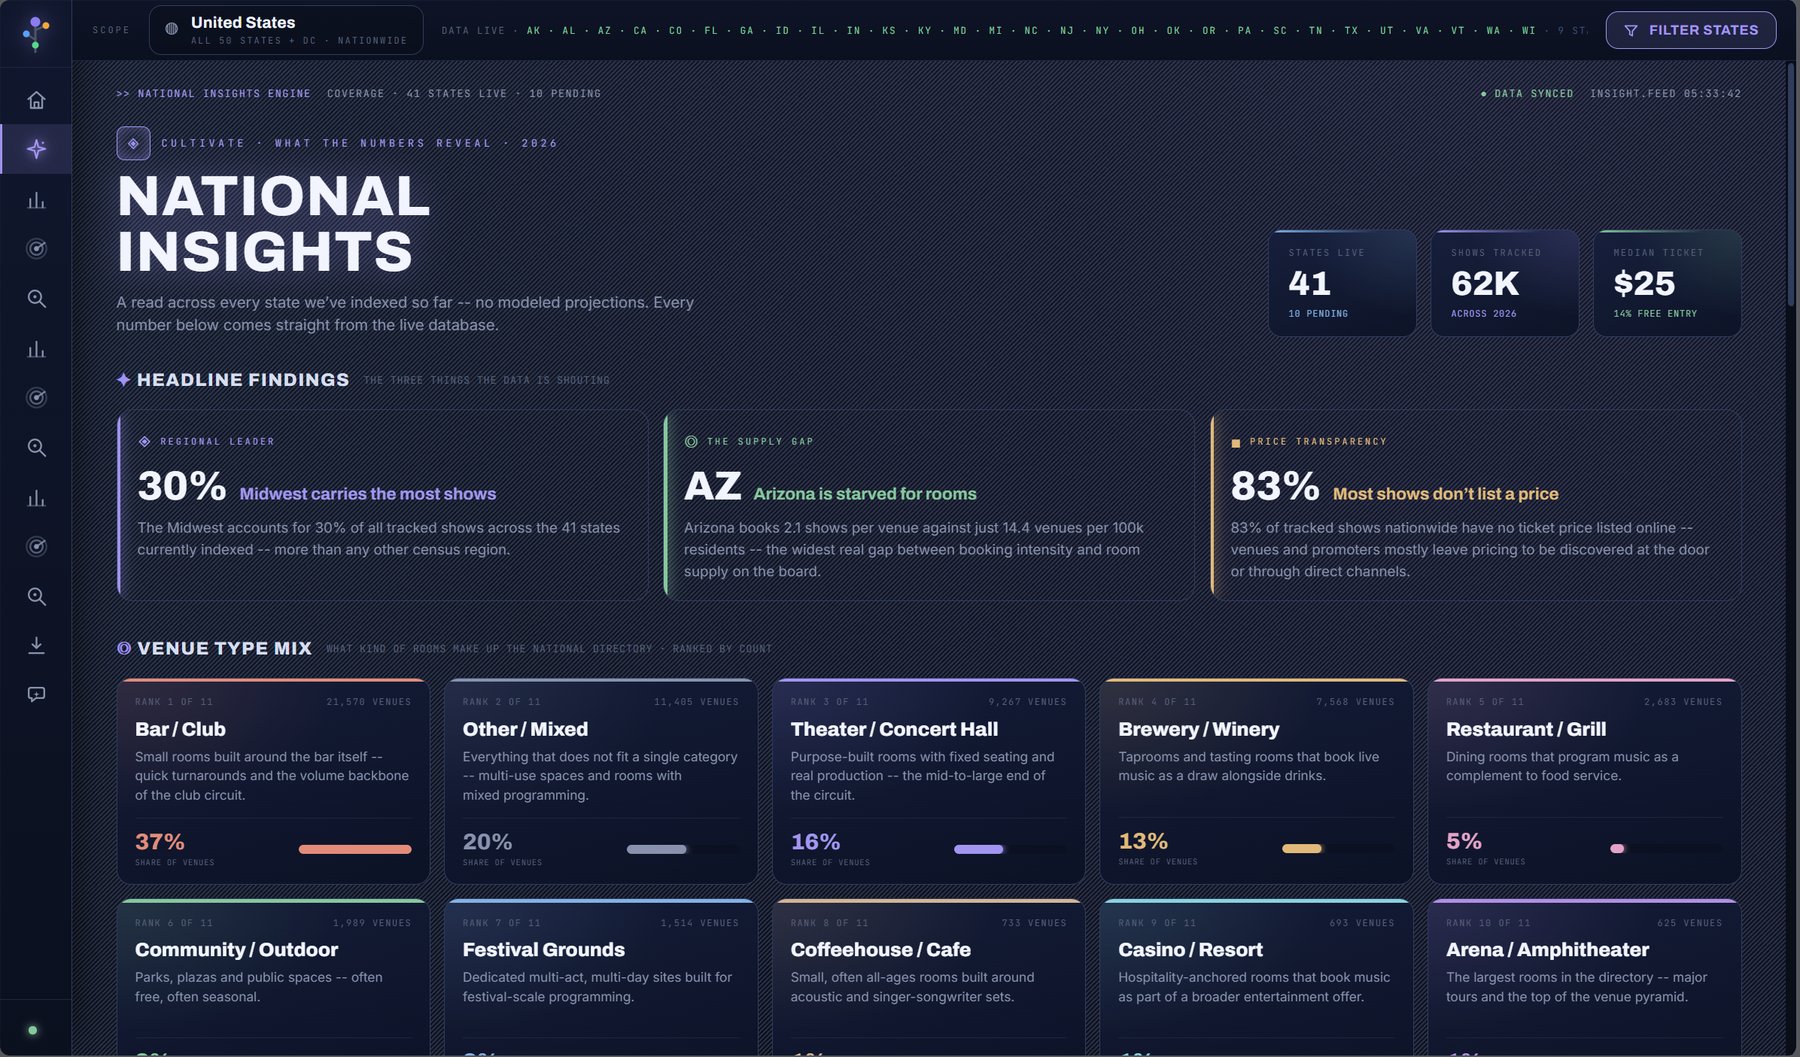
What the numbers reveal. Three headline findings the data is shouting, then the venue type mix, supply gaps and price transparency, straight from the live database. No modelled projections.
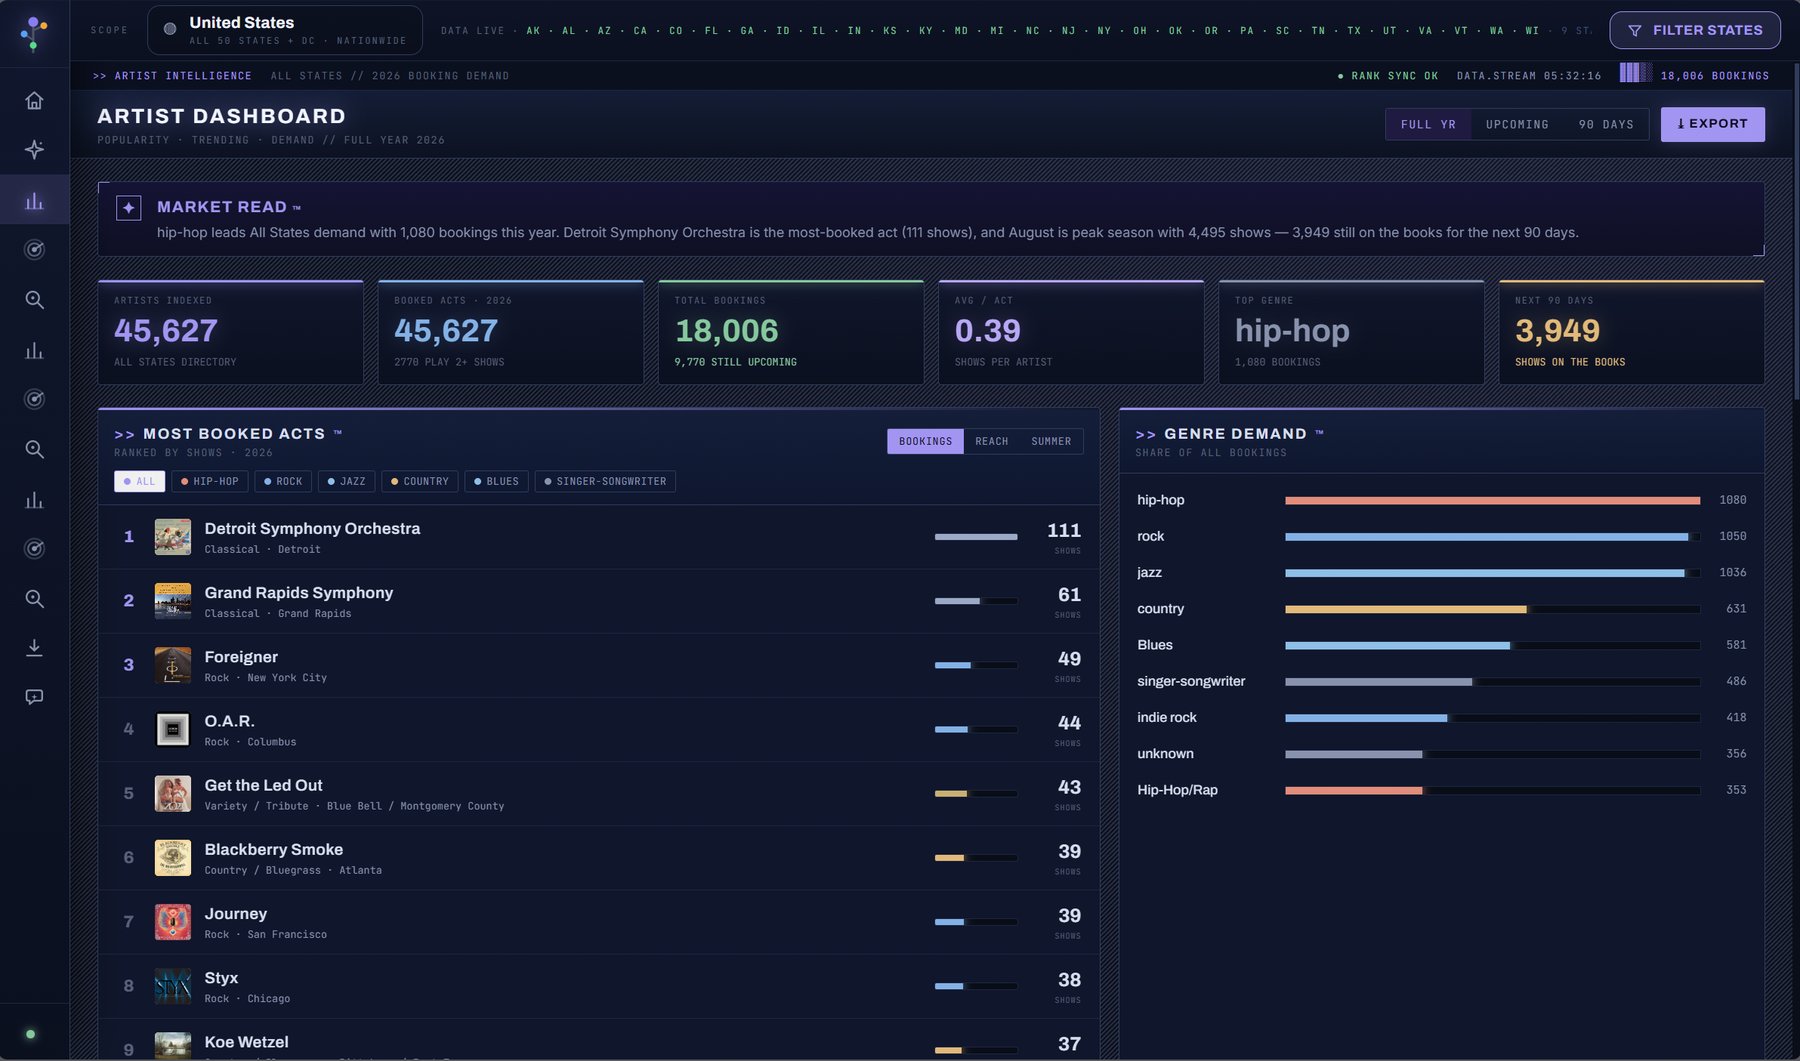
Who is being booked. A market read written by your AI Assistant, then the most-booked acts by bookings, reach or season, filtered by genre, next to genre demand for the whole scope.
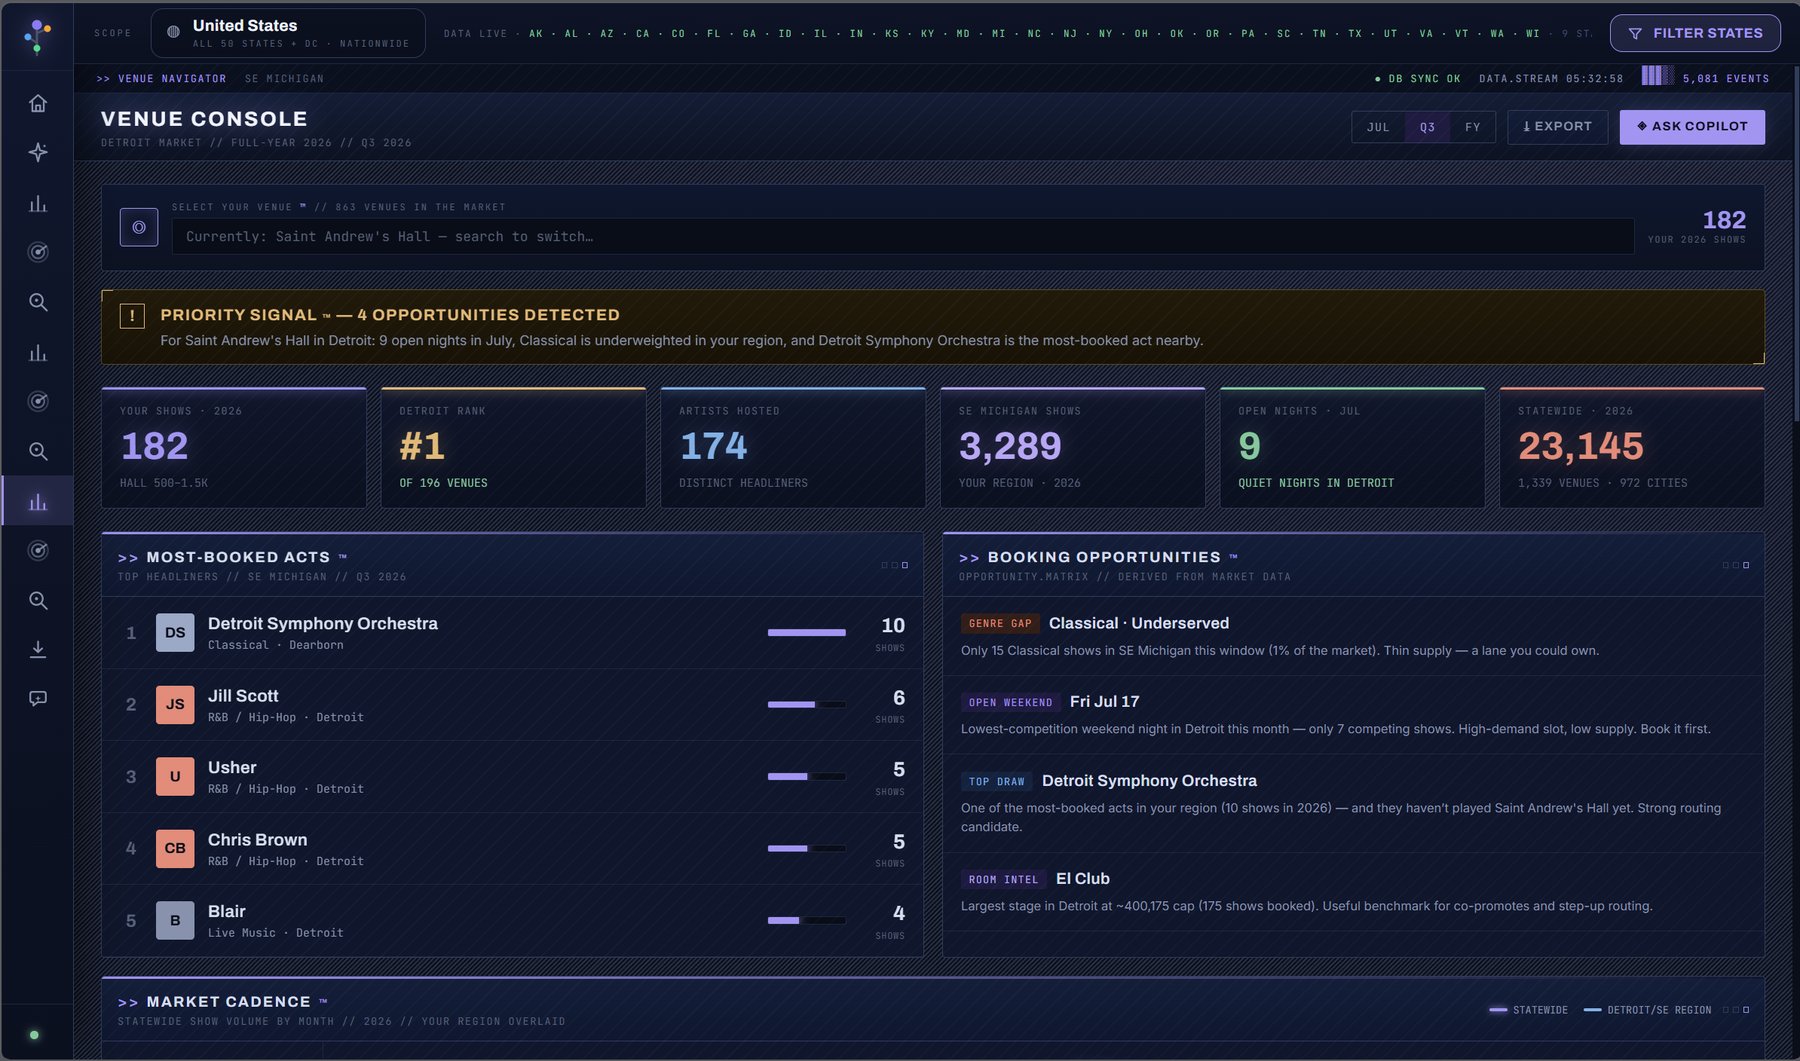
Your venue against the market. Pick your venue and the console reads it: rank in the city, open nights, the most-booked acts nearby, genre gaps you could own, and a Priority Signal written from what changed this week.
Reports
Leaderboards, trend lines and market snapshots built from the same live data, each with an AI-written takeaway and a clean print layout. Pick a state and every report narrows to it.

The booking-volume leaderboard with lineup diversity beside it. How many distinct artists a venue has actually hosted, not just how many shows.

The most-booked acts with reach alongside volume: how many distinct venues and cities an act has actually played.

All 51 markets side by side, sized against each state’s own population so a small state punching above its weight shows as clearly as a big one coasting.

Each state’s most-booked genre on one map, with regional signatures and state superlatives. Untagged listings excluded so the map shows real signal.

What is already on the books for the coming months, by month, genre, market and weeknight. The forward calendar, not last year’s.

Pick two states and compare them side by side: shows, venues, artists, festivals, genre mix, seasonality and top cities.

The biggest festivals on the circuit, music and community both, ranked by how often they come back and how big a crowd they draw.

Fairs, festivals, sports, arts and civic events: the non-music calendar that competes for the same Saturday night, and who runs it.

Farmers markets, storytimes, leagues and fairs ranked by how often they recur and the crowd they pull, not a one-off headcount.
Your dashboard
A personal dashboard merges your tours, tasks, favorites and alerts into one screen, and your AI Assistant writes the week's briefing across the top. Listen to it read aloud if you are on the move.
A shortlist of venues and acts, saved to Favorites and waiting in your pipeline.
A 20-minute walkthrough on your city, your venues and your artists.