Reports
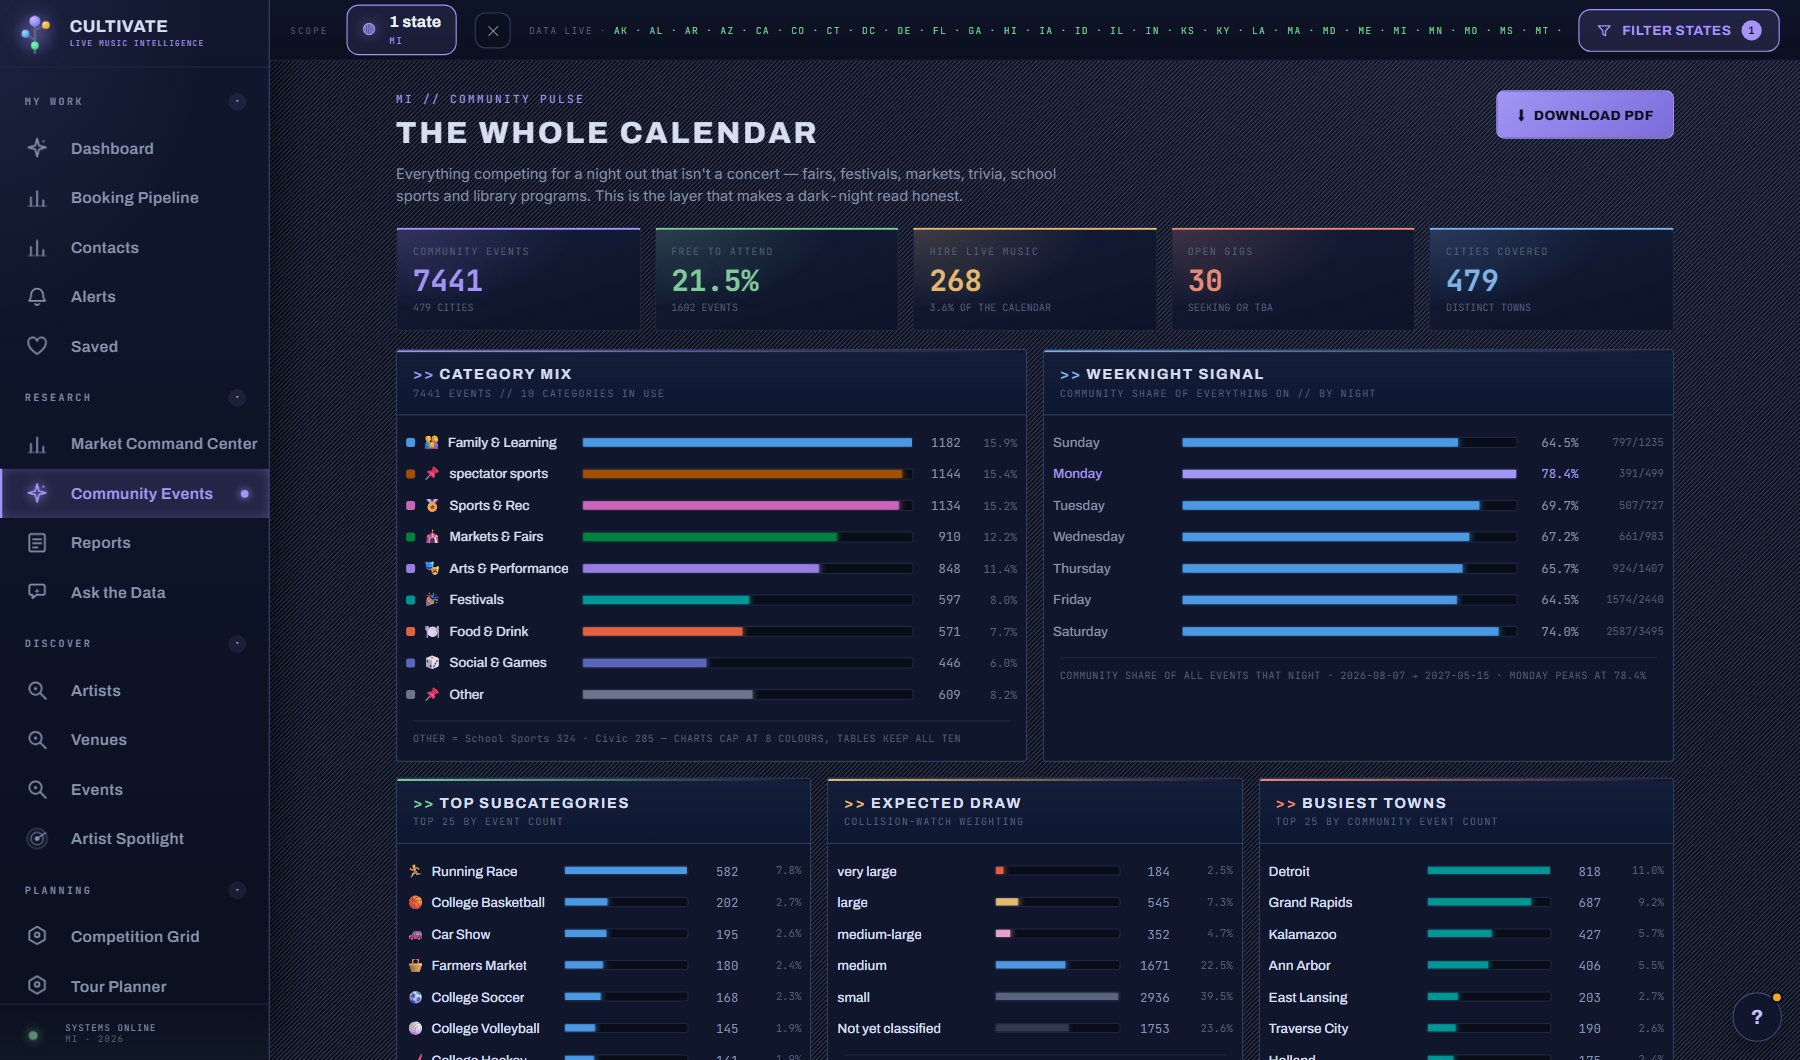
Thirteen shareable, printable reads of the market, laid out as a gallery with a picture of each: seven leaderboards (Top Artists, Top Venues, Top Cities, Rising Acts, Festival Circuit, Top Community Events, State Rankings; each a brochure with a cover, the figures, a podium, an AI read and a board of up to 250 rows), four market reads (State and Regional Snapshot, Music Pulse, Community Pulse, Market vs Market) and two posters (Sound Map, The Season Ahead). Each card says whether the report follows your state filter, asks you to pick states, or covers the whole country.
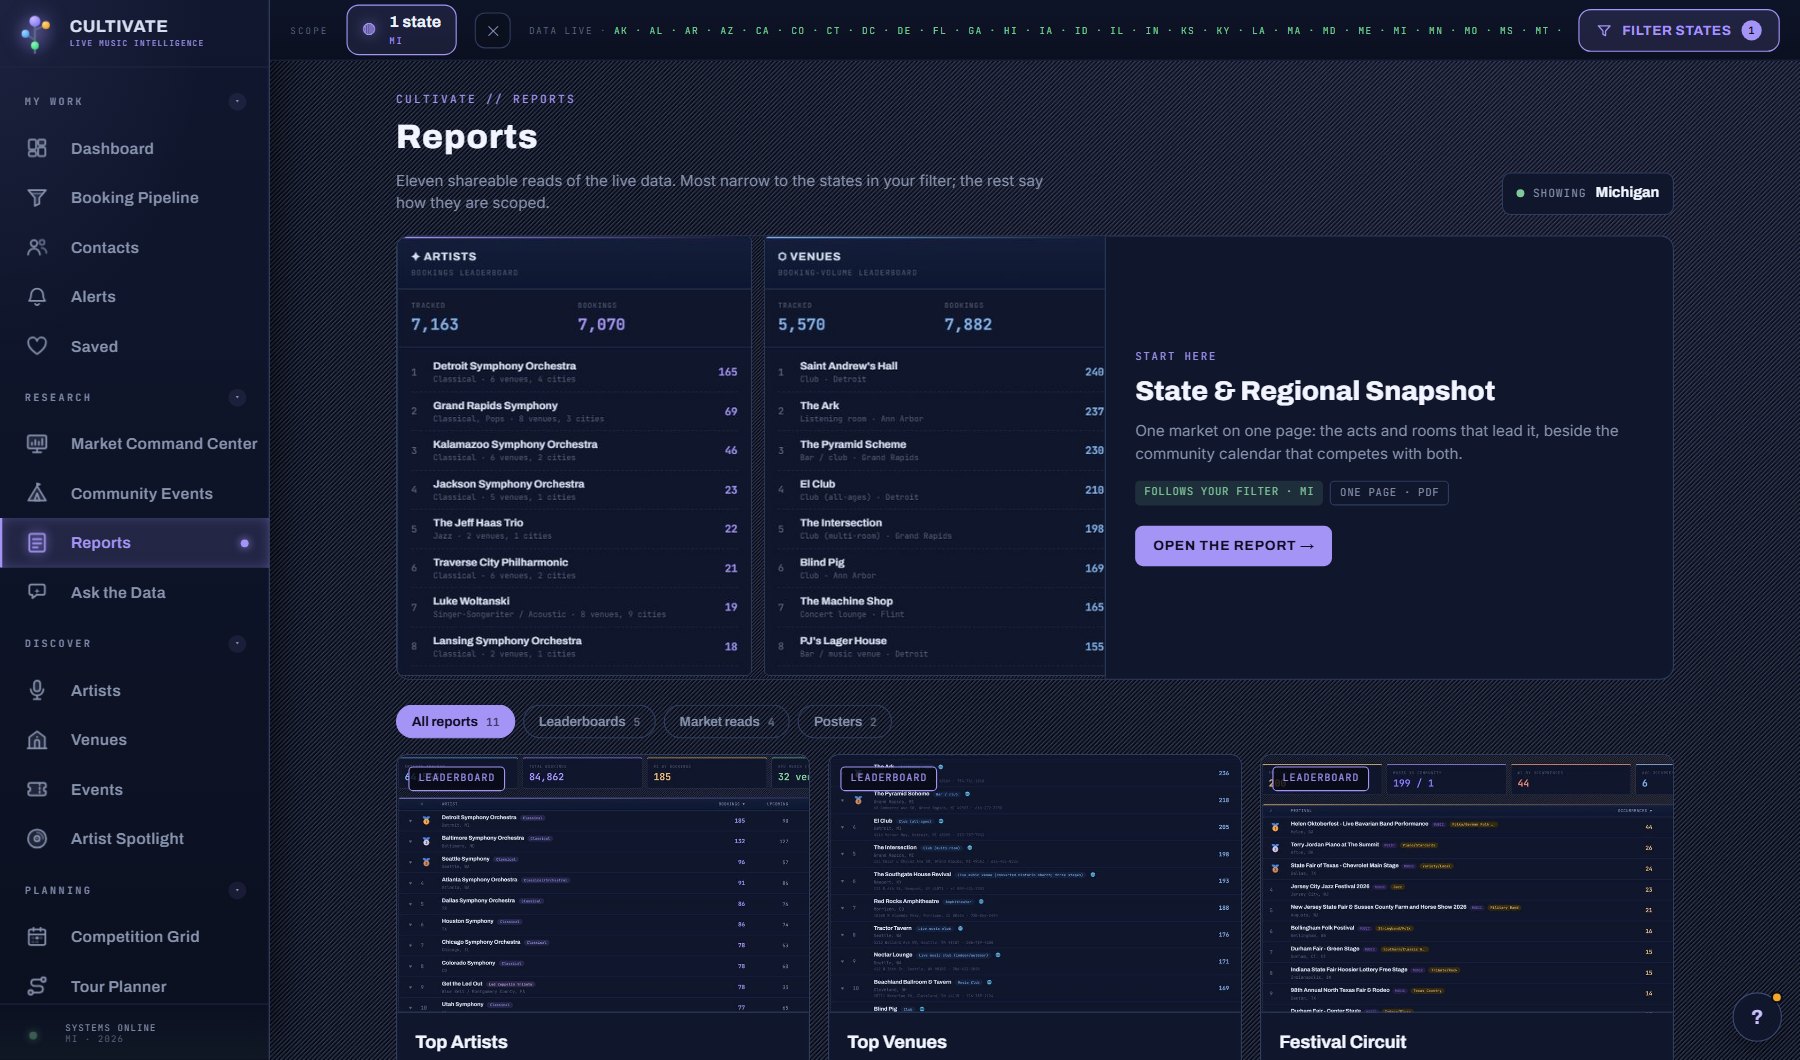
What is on the screen
- The gallery: a picture of each report, Start here, and chips for leaderboards, market reads, posters and scope.
- A leaderboard: a cover with the figures, a podium, the AI read, and a board of up to 250 rows; the INCLUDE ORCHESTRAS switch on the act boards.
- The market reads and posters, each built for print, with PRINT on every one.
Try this
- With one state in your filter, Start here opens that state's snapshot. With none, it opens the Sound Map.
- Use the chips to narrow to leaderboards, market reads or posters. Nothing is hidden until you do.
- Open Market vs Market and pick two states for a head-to-head.
- Print any report; the layout is built for paper and PDF.
- Read the AI takeaway paragraph on the infographic reports and on every leaderboard cover. It is written from the report's own numbers.
- Open Rising Acts to see who is playing your market more than they were (the last 90 days against the 90 before; switch to 60 or 180), and Top Cities for the markets ranked by live shows.
- Orchestras, symphonies and choirs are left out of Top Artists and Rising Acts by default (a season announcement lands dozens of dates at once and crowds the board); the switch above the cover puts them back and is remembered. Listings that name no act, such as TBA or and more, never appear.
The reports


AI on this screen
The cost is on the button before you press it. Reopening a saved report is free, and nothing is charged for an error or an empty answer. See AI credits.
Plan
Every plan. See plans and seats.
Related screens
Where to find it
In the console: Research > Reports. Press ? on any screen for this guide inside the console, or open the screen if you are signed in.