The venue window
What opens when you click a venue anywhere in the console: the left column that stays put, and the seven tabs (Overview, Analytics, Calendar, Booking, Demographics, Photos, AI), with a picture of each.
Opening it, and the column that stays put
Click a venue's name anywhere in the console (a search result, a report row, a concentration table, a project row, an act's show card) and its window opens over the page. Escape or the ✕ closes it.
The left column stays while you move between tabs: the initials tile or photo, the name, the city, region and county, the type chip and whether the record is verified, the size tier, the three buttons (+ ADD TO PROJECT, PITCH THIS VENUE, ✦ ASK ABOUT THIS VENUE), four counts (this year's shows, distinct acts, capacity, established), type and ages, free shows and festivals, the address and phone, and the links (website, map, street view, the socials).
The pictures in this guide are the window on Venue Search. It is the same window wherever a venue opens.
Overview
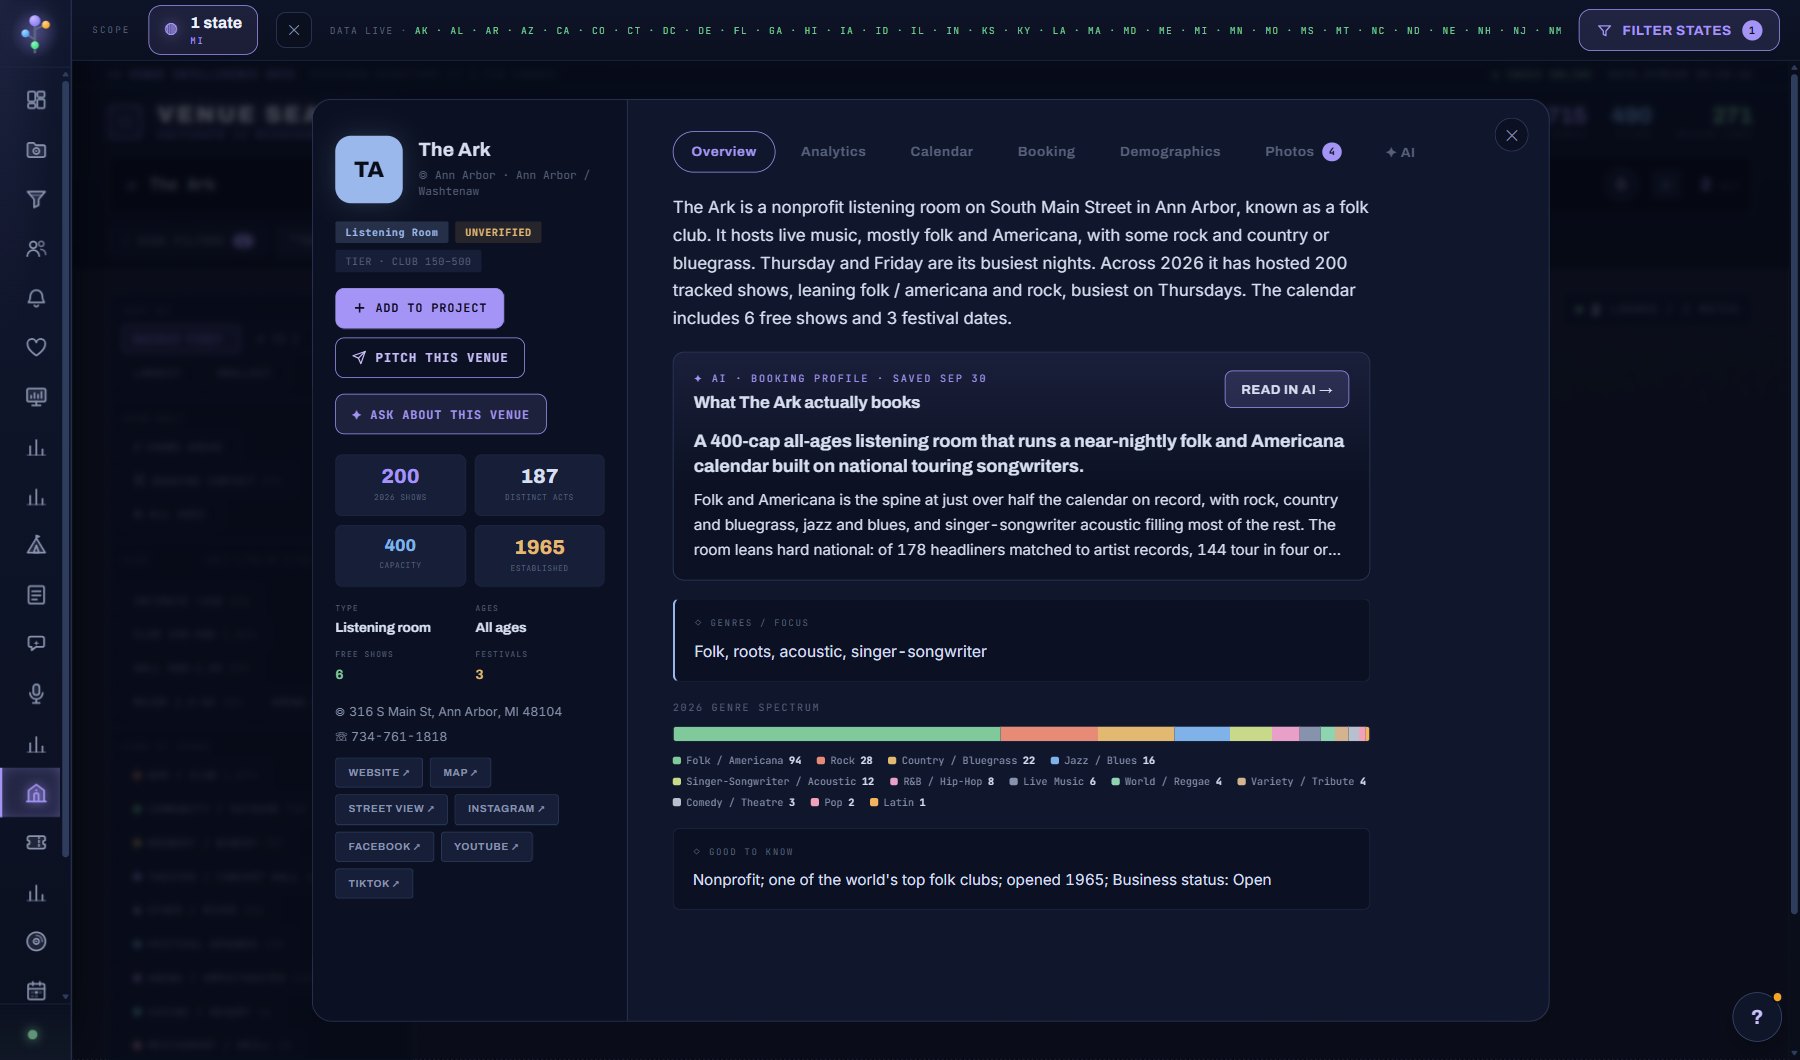
A written summary of the venue first: what it is, what it hosts, its busiest nights, this year's tracked shows and how they lean, free shows and festival dates.
Then the AI Booking Profile card: the saved profile's first lines (what the venue actually books, in one sentence, then the opening paragraph) with READ IN AI, or a BUILD PROFILE button when none exists yet.
Under it: Genres / focus in words, the year's genre spectrum as one bar with the count per genre, and Good to know (nonprofit, opened when, business status and the like).
Analytics
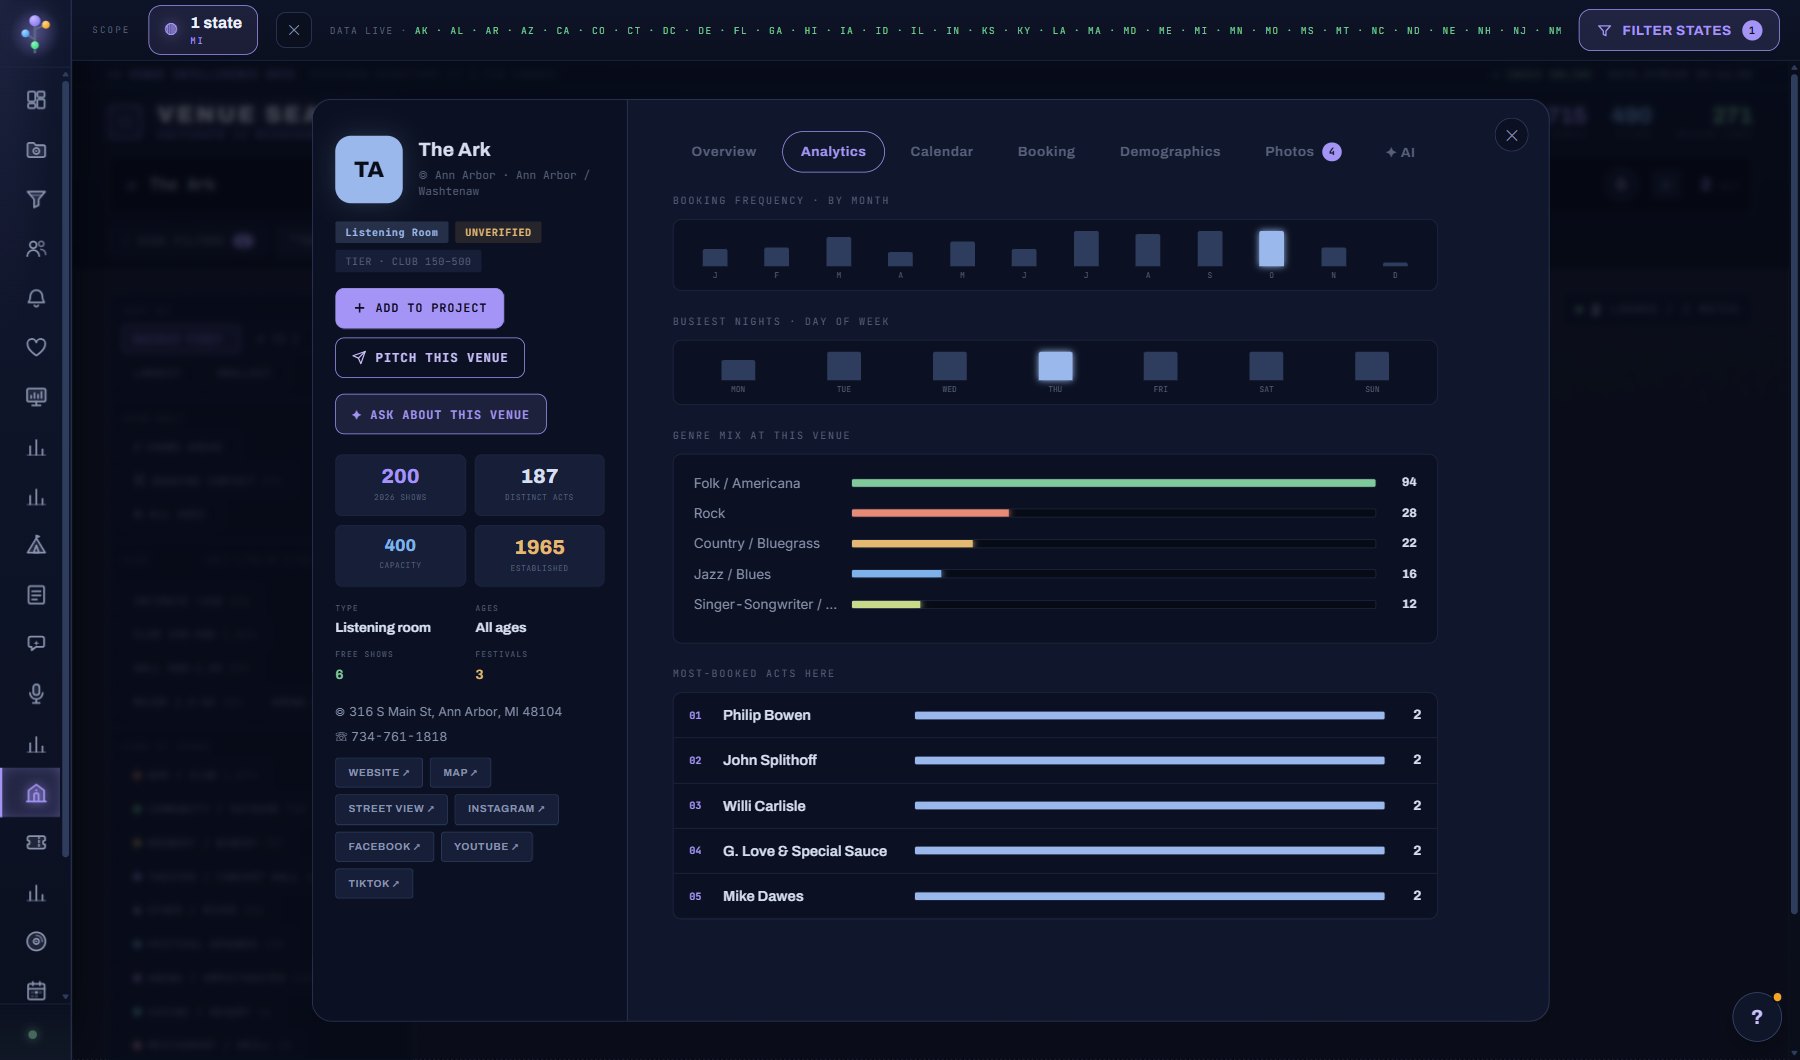
Four charts from the shows on record: booking frequency by month, busiest nights by day of the week, the genre mix at this venue as bars with counts, and the most-booked acts here, ranked.
Read them together before you pitch: the month the calendar is thinnest, the night it is quietest, the genre it books most and least, and the acts it keeps bringing back.
Calendar
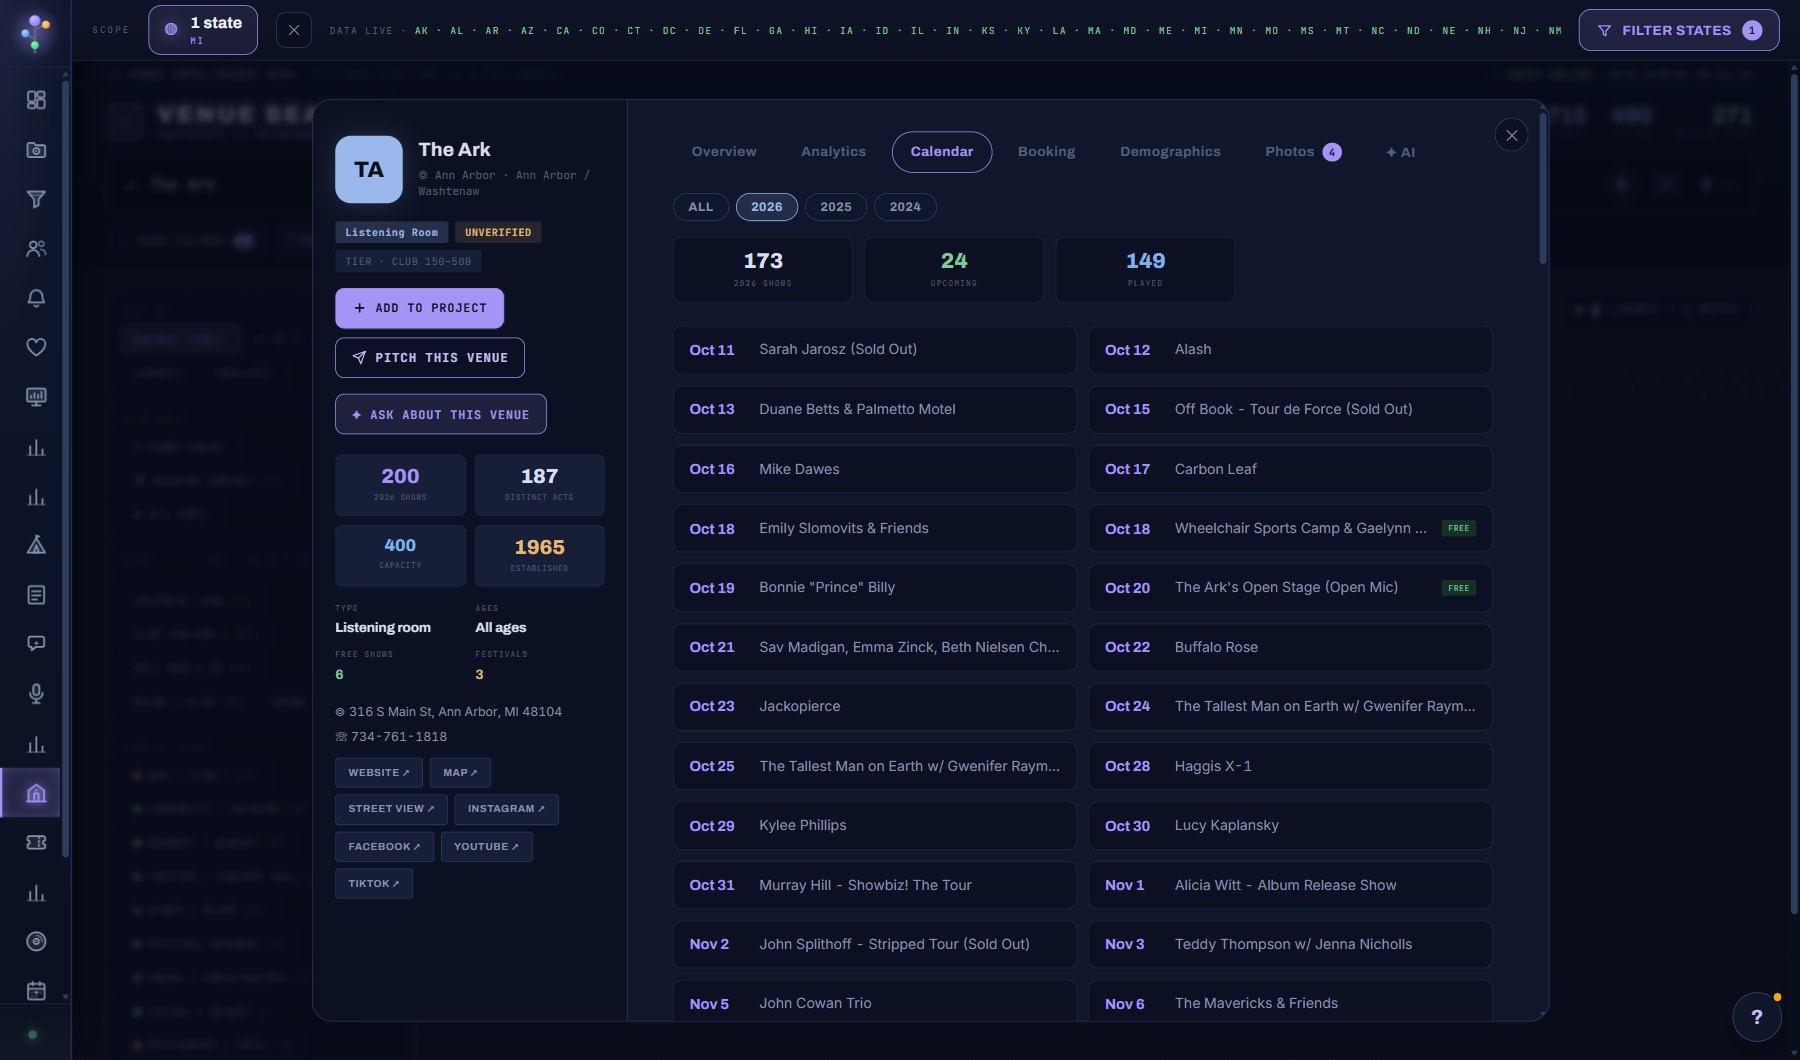
Every show on record at the venue, two columns of date rows, newest first within the year chosen (ALL or one year). Three counts above: the year's shows, upcoming and played. Sold out and free shows are marked.
Click an act's name to open the act window on top; Escape brings the venue back.
Booking
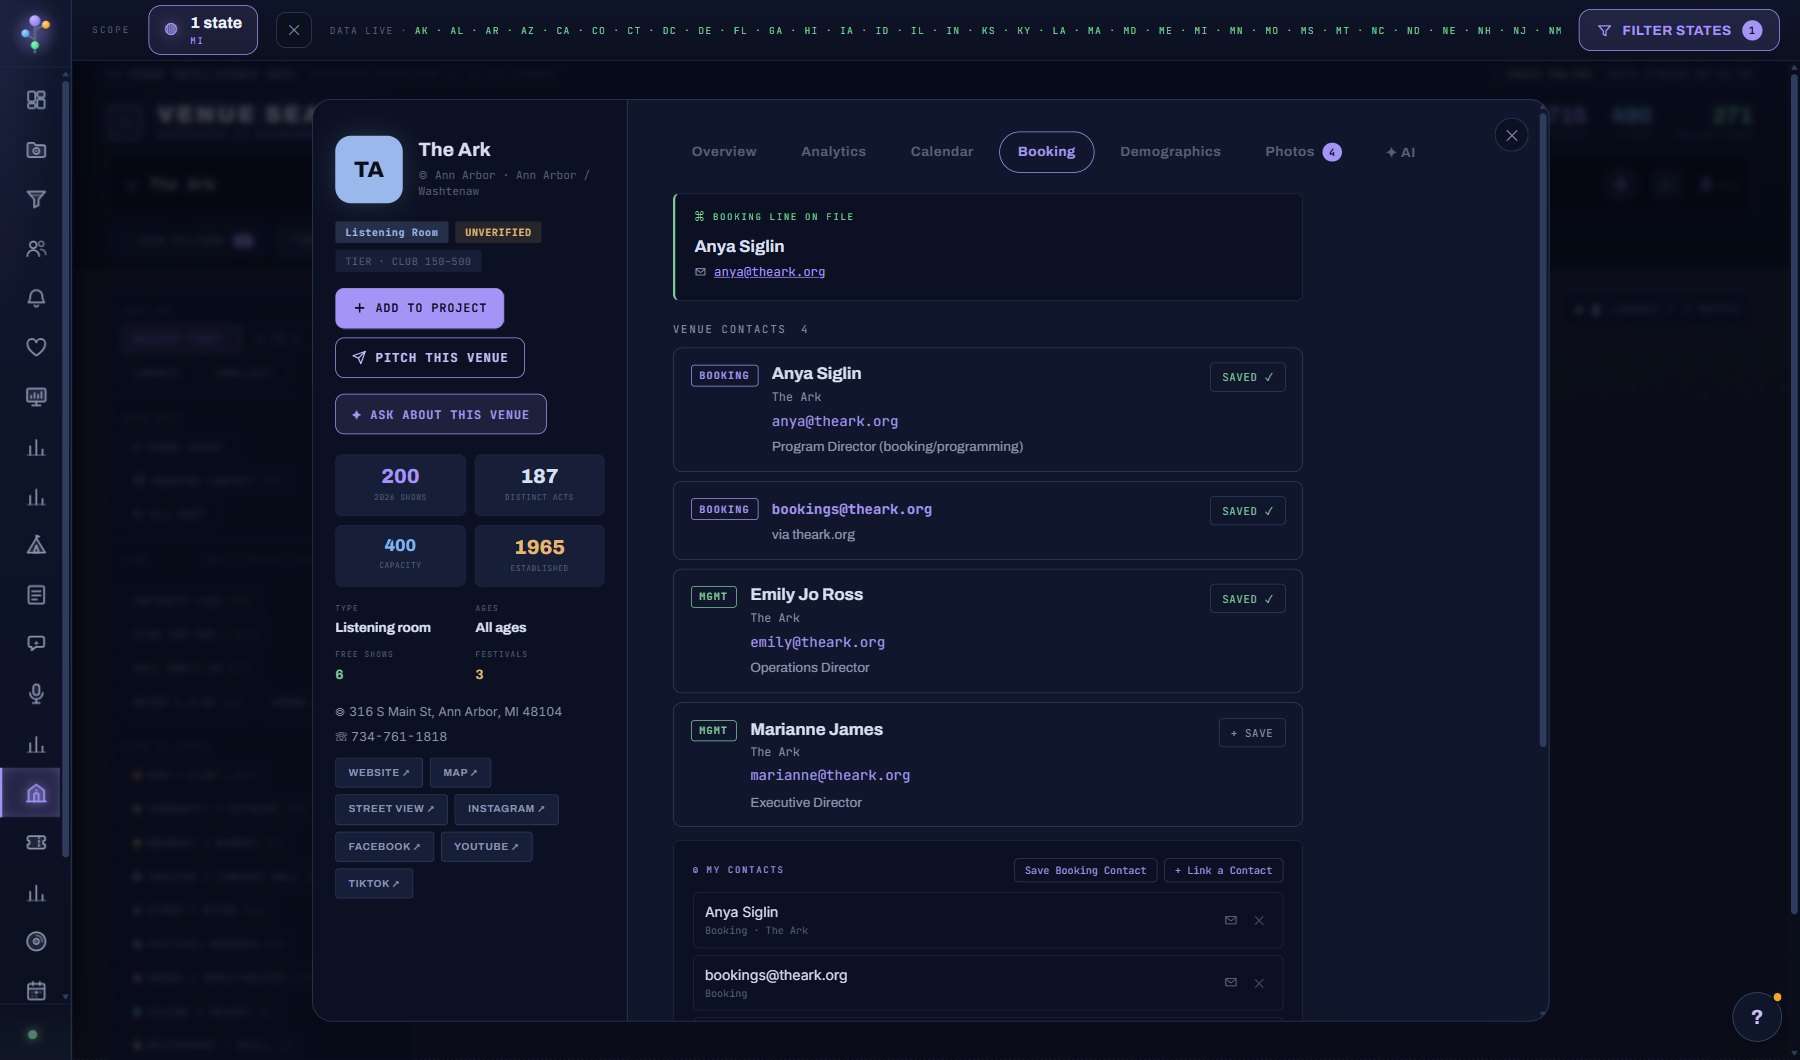
The booking line on file (the person and address Cultivate holds for this venue) at the top, then every venue contact found: the role chip (BOOKING, MGMT), the name, the venue, the address and the title, each with + SAVE or SAVED ✓.
My contacts, under them, is yours: the contacts you have saved for this venue, with Save Booking Contact and + Link a Contact. A saved contact appears on your Contacts page and on every project the venue is in.
Demographics
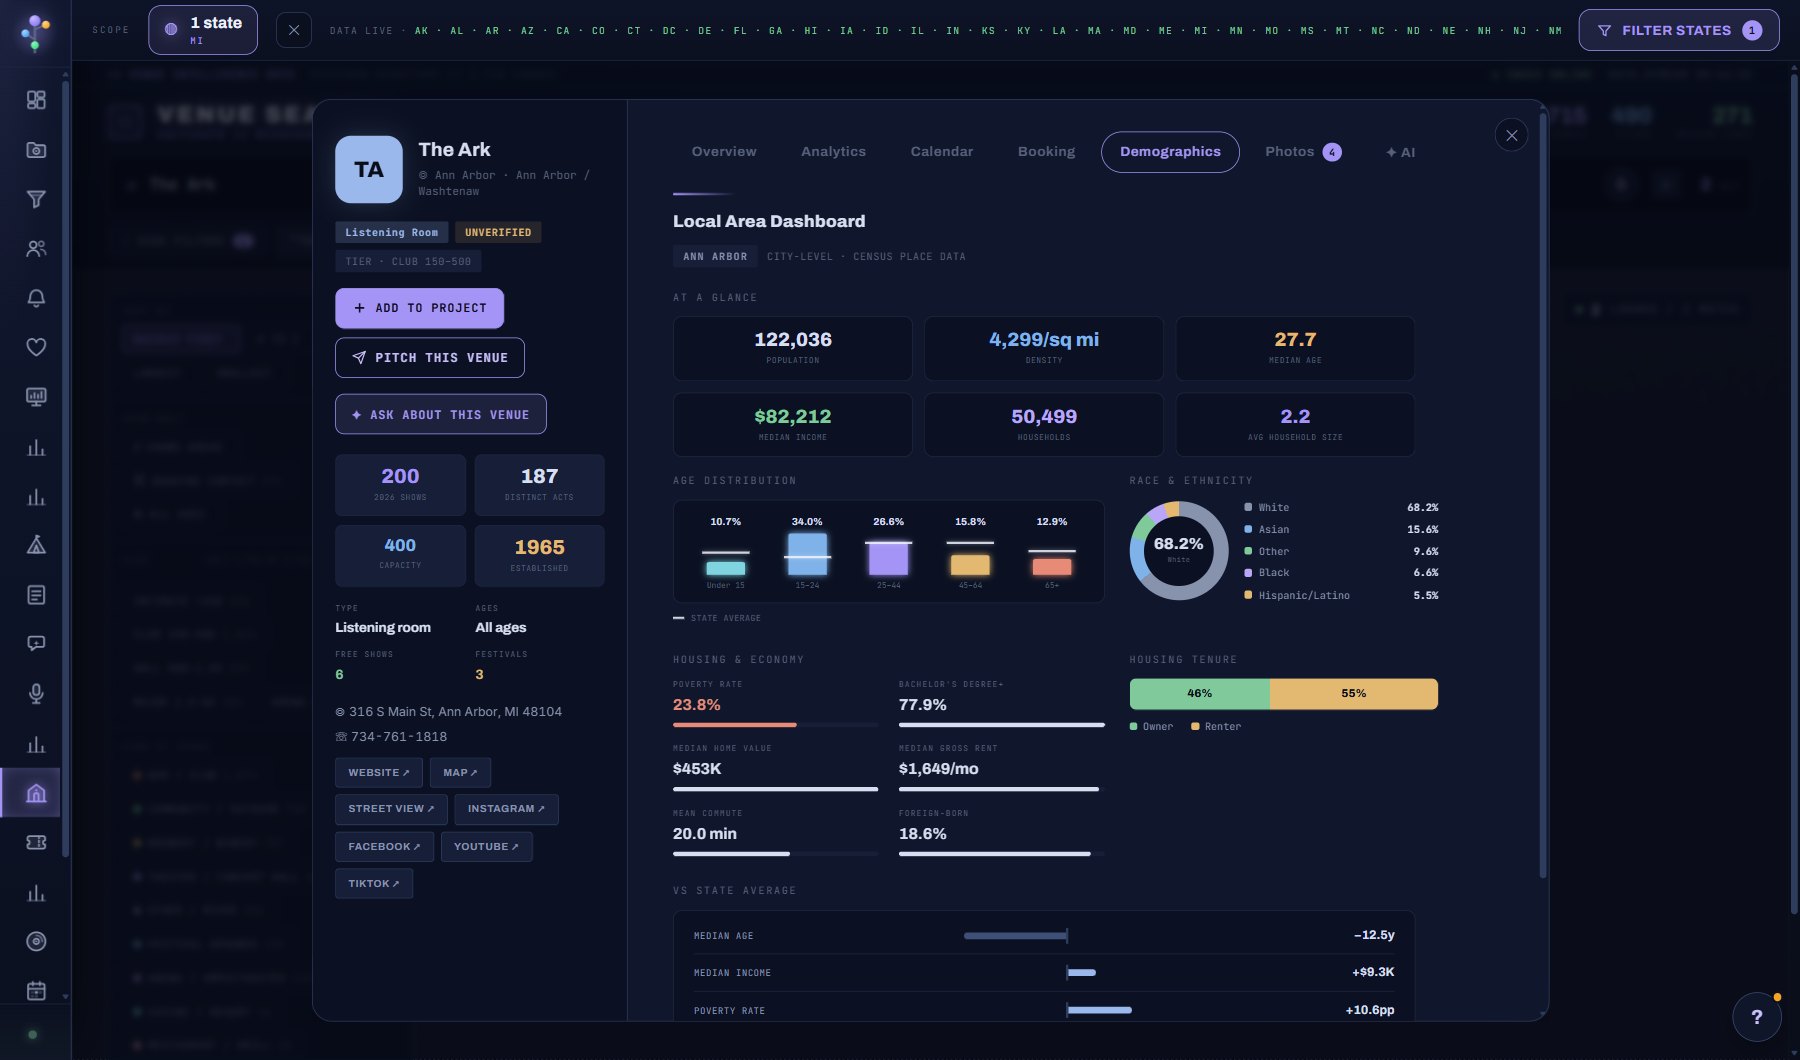
The Local Area Dashboard for the venue's city, from Census place data: population, density, median age, median income, households and household size at a glance; the age distribution against the state average; race and ethnicity; housing and economy (poverty rate, degrees, home value, rent, commute, foreign-born); housing tenure; and a Vs state average strip.
It is the venue's city, not a radius: the same dashboard for every venue in that place.
Photos
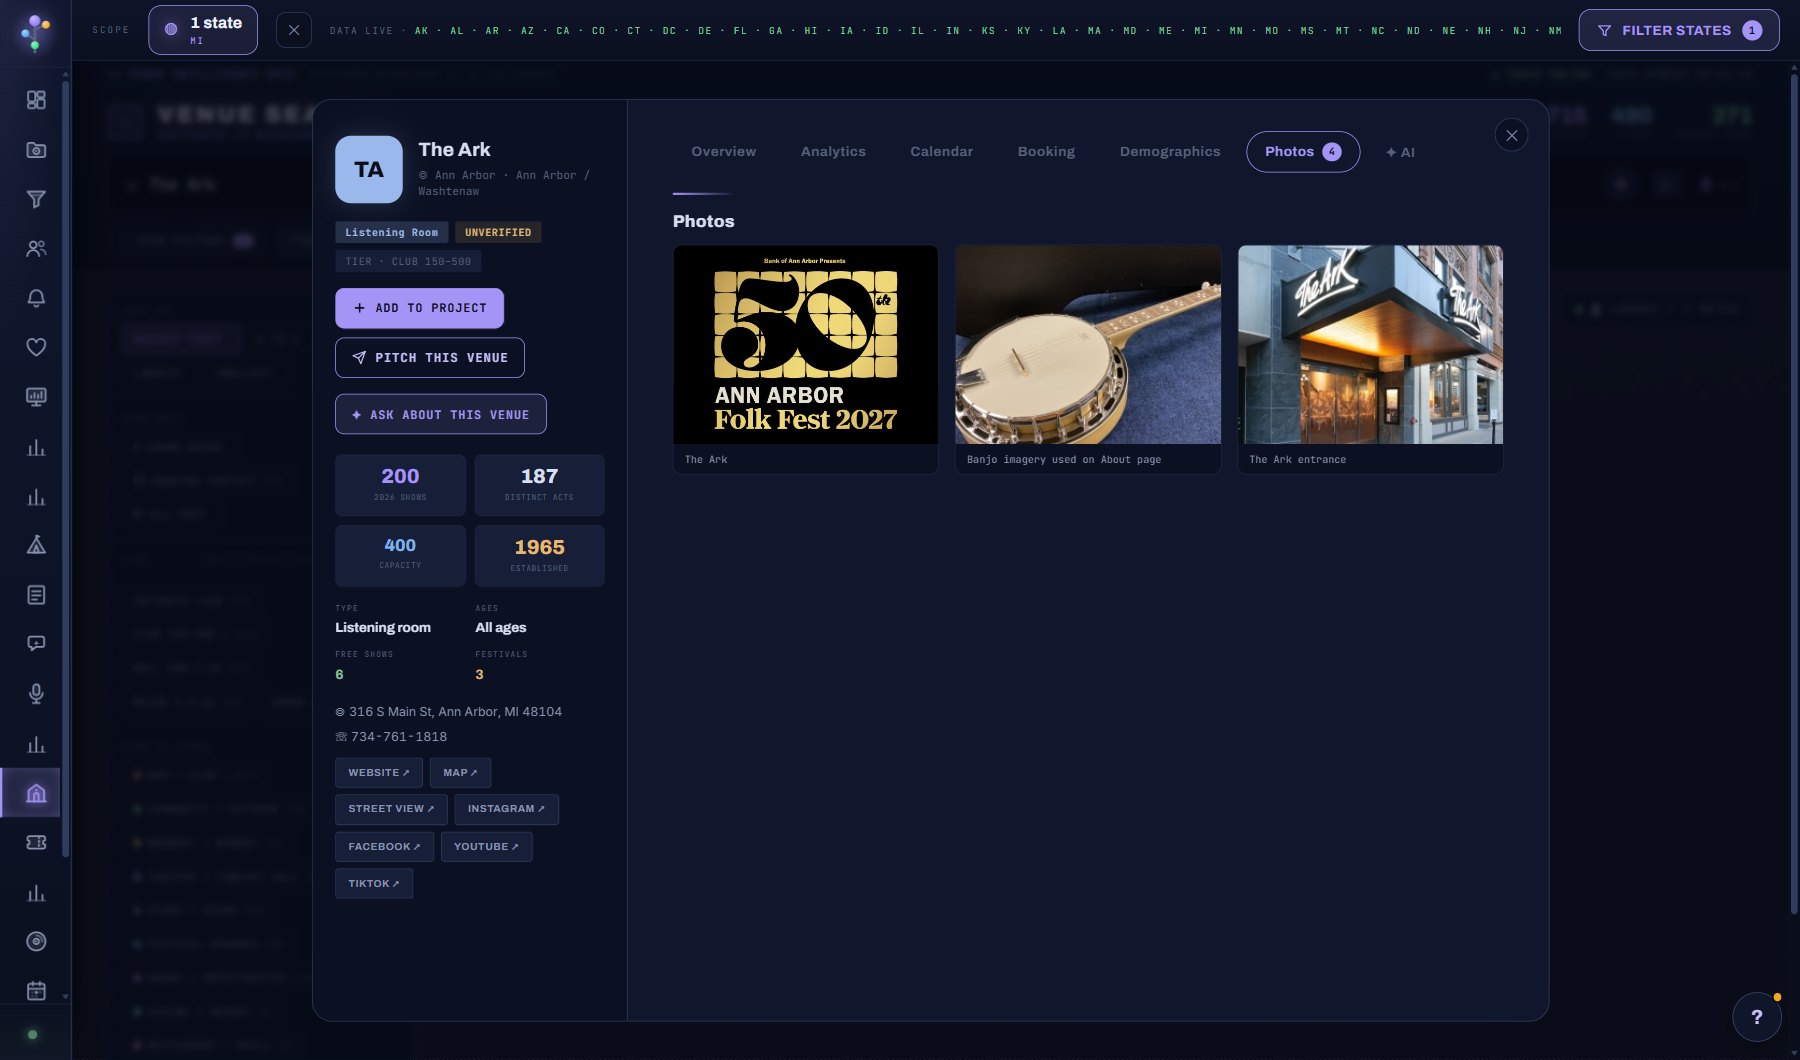
The venue's pictures with their captions, from the venue's own site and listings. The count sits on the tab. A venue with no photos keeps its initials tile in the left column.
AI
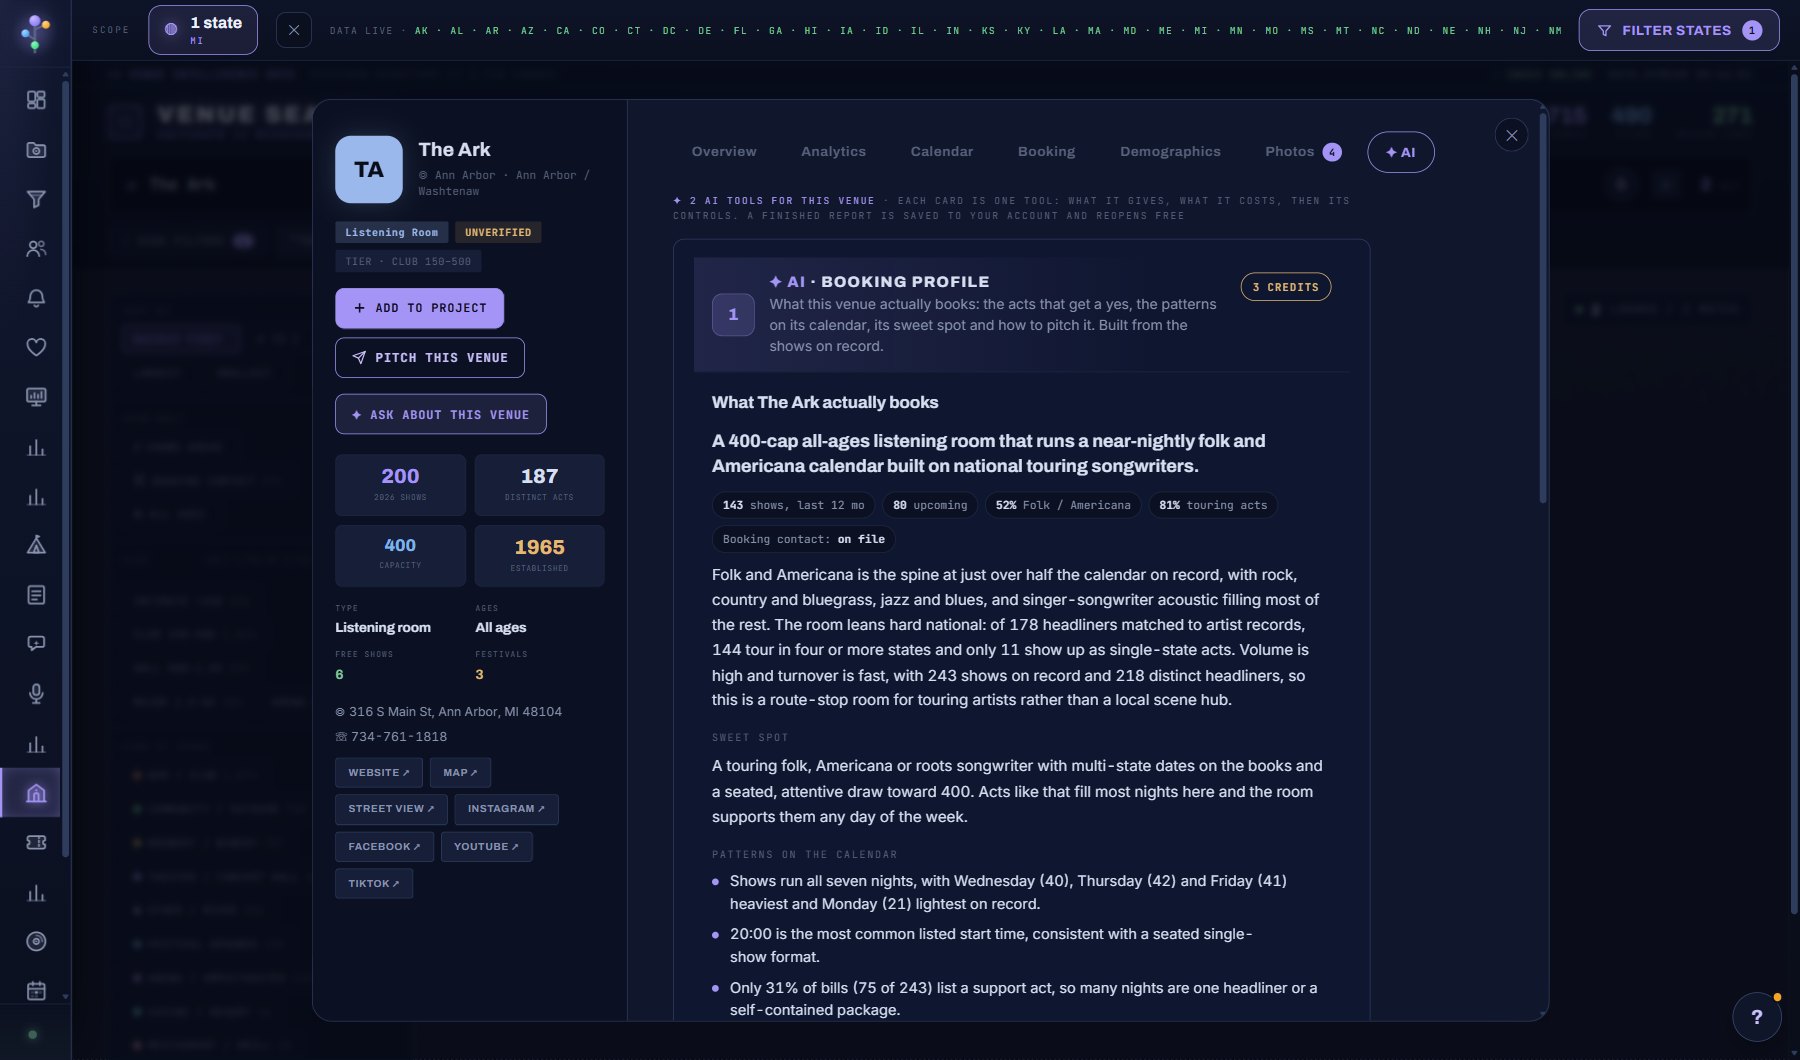
The AI tools for this venue, one card each: what it gives, what it costs, then its controls. A finished report is saved to your account and reopens free.
Booking Profile (3 credits): what the venue actually books: the acts that get a yes, the patterns on its calendar, its sweet spot and how to pitch it, built from the shows on record. Once built it opens here in full and its first lines sit on Overview.
Act and Venue Fit (2 credits): pick one of your acts and get the fit read for this venue: genre, size, geography, audience and activity, with the score explained.
The ✦ ASK ABOUT THIS VENUE button in the left column is the free way in: the assistant answers from the record without a report.
Where to find it
In the console: Discover > Venues. Press ? on that screen for the short version, or open the screen if you are signed in. The screen's own page: Venue Search.